Thursday 30 July 2015

Mixed Grain Fact Table

A mixed grain fact table is a fact table where we have measures with different grain. For example, one measure is weekly whereas the other measure is monthly. In this post I’d like to go through the advantages and disadvantages of that approach. The Kimball group clearly stated that measures in a fact table must have the same grain, see Kimball’s Toolkit book chapter 2.
As usual it is easier to explain “by example”:
It is a data mart. They have measures per week and per month, but they don’t have the measure on daily basis. Should we have 2 fact tables, one for weekly and one for monthly, like this: (1)
Or should we create a mixed grain fact table like this: (2)
In the above fact table, the black lines are weekly figures, whereas the red lines are monthly figures. They are both put in the same fact table, but on different measure columns. On the rows where the weekly measure exist, the monthly measure is zero. And vice versa. Therefore weekly and monthly total are correct:
select D.Week, sum(F.WeeklyMeasure) from FactMixedGrain F
join DimDate D on F.DimDate = D.DimDate group by D.Week
Result:
select D.Month, sum(F.MonthlyMeasure) from FactMixedGrain F
join DimDate D on F.DimDate = D.DimDate group by D.Month
Result:
Usually the main reason of doing option (2) is to have both the weekly and monthly measures in 1 fact table. This is done to save development effort, particularly ETL effort. It is easier to populate just 1 table than two tables.
That’s the advantage. Now the disadvantages. The issue with option (2) is that the grain of the fact table is mixed. There are 2 grains. In practice we have other dimension key columns in the fact table. And we also have other measure columns in the fact table. Some of these measures are weekly and some of them are monthly. Perhaps some of these measures are daily.
The issues with a fact table with a mixed grain like that are:
  1. When the reporting from the table, we are risking mixing measures with different grains in the same formula, resulting in meaningless result.
  2. The DateKey is used to indicate both the end of week and the end of month. This requires certain logic in the ETL, which prolong its development.
  3. In the fact table we have black and red lines, indicating weekly and monthly grain. Black for weekly and red for monthly. We may end up having yellow lines too, for daily. And blue lines too, for quarterly. Oh, and green lines too, for yearly. After that, it will be very confusing. When we query the fact table, we wouldn’t be able to tell which line is which.
  4. When we join this fact table with another fact table (drilling across), we are risking joining the wrong rows.
In option (2) above, the date dimension is used for 2 different grains in the fact table. Other examples like this are:
  1. Product dimension used at the product group level and at the product category level.
  2. Customer dimension used at the company level and at the group level.
When we have 2 or 3 dimensions, with each has dual grain like that, it becomes really confusing and risky.
In the above example, the same dimension key column has dual grain. In other cases, the mixed grain in the fact table is caused by different dimension key columns. One measure correspond to dim1, where as another measure correspond to dim2. Where measure1 has value, measure 2 is 0. And vice versa, like this:
And so it becomes really confusing. So I would recommend avoiding this design, mixing measures with different grains into the same fact table. Instead, it is better to put them into separate fact tables.

Complex SQL Scenario


Case1:Pick the max DATE1 if multiple distinct values.
Case2:If  no value or same value exists for DATE1 then pick maximum value from DATE2


SELECT
CLIENT_ID,
CASE 
WHEN COUNT(
DISTINCT  COALESCE(DATE1,TO_DATE('01-JAN-00','DD-MON-YY')))>1 
THEN MAX(DATE1) 
ELSE
MAX(DATE2)
END
FROM ADHOC
GROUP BY CLIENT_ID

Wednesday 29 July 2015

Performance Tuning steps for Informatica Mapping

1. Reduce the number of transformations. There is always overhead involved in moving data between transformations.
2. Consider more shared memory for large number of transformations. Session shared memory between 12MB and 40MB should suffice.
3. Calculate once, use many times.

  • Avoid calculating or testing the same value over and over.Calculate it once in an expression, and set a True/False flag.
  • Within an expression, use variable ports to calculate a value than can be used multiple times within that transformation.
  • Delete unnecessary links between transformations to minimize the amount of data moved, particularly in the Source Qualifier.
  • This is also helpful for maintenance. If a transformation needs to be reconnected, it is best to only have necessary ports set as input and output to reconnect.
  • In lookup transformations, change unused ports to be neither input nor output. This makes the transformations cleaner looking. It also makes the generated SQL override as small as possible, which cuts down on the amount  of cache necessary and thereby improves performance.
  • The engine automatically converts compatible types.
  • Sometimes data conversion is excessive. Data types are automatically converted when types are different between connected ports. Minimize data type changes between transformations by planning data flow prior to developing the mapping.
  • Plan for reusable transformations upfront.
  • Use variables. Use both mapping variables as well as ports that are variables.Variable ports are especially beneficial when they can be used to calculate a complex expression or perform a disconnected lookup call only once instead of multiple times
  • Use mapplets to encapsulate multiple reusable transformations.
  • Use mapplets to leverage the work of critical developers and minimize mistakes when performing similar functions.
  • Reduce the number of non-essential records that are passed through the entire mapping.
  • Use active transformations that reduce the number of records as early in the mapping as possible (i.e., placing filters, aggregators as close to source as possible).
  • Select appropriate driving/master table while using joins. The table with the lesser number of rows should be the driving/master table for a faster join.
  • Redesign mappings to utilize one Source Qualifier to populate multiple targets.This way the server reads this source only once. If you have different Source Qualifiers for the same source (e.g., one for delete and one for      update/insert), the server reads the source for each Source Qualifier.
  • Remove or reduce field-level stored procedures.
  • If you use field-level stored procedures, the PowerCenter server has to make a call to that stored procedure for every row, slowing performance.

4. Only connect what is used.
5. Watch the data types.
6. Facilitate reuse.
7. Only manipulate data that needs to be moved and transformed.
8. Utilize single-pass reads.
9. Sort the input data before passing to Joiner and Aggregate transformation.
10. In Lookup using customize query instead of default query. (Use '--' to overwrite lookup default order by clause).
11. Avoid using un-neccessary columns/port in sql query.
12. Filter un-neccessary data as closer to the source qualifier. (In case of Relational database include filter condition to the sql query).
13. In Joiner consider lesser value of data as Master Table.
14. In-case of mapping partition place aggregate transformation before the partition point.
15. Use Router instead of having multiple Filter transformations.

Generate date sequence given a range


SELECT TO_DATE('01-JUN-2015') + ROWNUM - 1
FROM (
  SELECT ROWNUM FROM (
    SELECT 1 FROM DUAL
    CONNECT BY LEVEL <= (
TO_DATE('01-JUL-2015') - TO_DATE('01-JUN-2015')
                                                  )
                                                  )
           );

Difference between Conceptual, Logical and Physical Data Models.

The three level of data modeling:-


Conceptual data model

A conceptual data model identifies the highest-level relationships between the different entities. Features of conceptual data model include:
·         Includes the important entities and the relationships among them.
·         No attribute is specified.
·         No primary key is specified.

Logical data model

A logical data model describes the data in as much detail as possible, without regard to how they will be physical implemented in the database. Features of a logical data model include:
·         Includes all entities and relationships among them.
·         All attributes for each entity are specified.
·         The primary key for each entity is specified.
·         Foreign keys (keys identifying the relationship between different entities) are specified.
·         Normalization occurs at this level.
The steps for designing the logical data model are as follows:
1.     Specify primary keys for all entities.
2.     Find the relationships between different entities.
3.     Find all attributes for each entity.
4.     Resolve many-to-many relationships.
5.     Normalization.

Physical data model

Physical data model represents how the model will be built in the database. A physical database model shows all table structures, including column name, column data type, column constraints, primary key, foreign key, and relationships between tables. Features of a physical data model include:
  • Specification all tables and columns.
  • Foreign keys are used to identify relationships between tables.
  • Denormalization may occur based on user requirements.
  • Physical considerations may cause the physical data model to be quite different from the logical data model.
  • Physical data model will be different for different RDBMS. For example, data type for a column may be different between Oracle, DB2 etc.
The steps for physical data model design are as follows:
  1. Convert entities into tables.
  2. Convert relationships into foreign keys.
  3. Convert attributes into columns.
  4. Modify the physical data model based on physical constraints / requirements.

Here we compare these three types of data models. The table below compares the different features:
Feature
Conceptual
Logical
Physical
Entity Names

Entity Relationships

Attributes


Primary Keys

Foreign Keys

Table Names


Column Names


Column Data Types


Conceptual Model Design 


Logical Model Design
Physical Model Design


We can see that the complexity increases from conceptual to logical to physical. This is why we always first start with the conceptual data model (so we understand at high level what are the different entities in our data and how they relate to one another), then move on to the logical data model (so we understand the details of our data without worrying about how they will actually implemented), and finally the physical data model (so we know exactly how to implement our data model in the database of choice). In a data warehousing project, sometimes the conceptual data model and the logical data model are considered as a single deliverable.

Snowflake Schema: "Need of the Hour"

In snowflake schema, you further normalize the dimensions. Ex: a typical Date Dim in a star schema can further be normalized by storing Quarter Dim, Year dim in separate dimensions. 

Snowflake schema is generally used if:

1) You have a requirement where you don't need to frequently query a certain set of dimension data but still need it for information purposes. By storing this data in a separate dimension,  you are reducing redundancy in main dimensions.

2) You have a reporting or cube architecture that needs hierarchies or slicing feature. 

3) You have fact tables that have different level of granularity. Ex: You have sales fact table where you are tracking sales at product level. Then you also have budget fact table where you are tracking budgeting by product category. 

It is, however, not recommended because it increases the joins and complexity of your query and hence slows down the performance.

PS: Bridge tables are not snowflake but bridge tables. The purpose of bridge tables are to resolve m:m relationship. A snowflake dimension would have further (or leaf level) information of the parent dimension stored for usability and storage.

When does it make sense to use a Snowflake Schema vs. Star Schema in database design?

A star schema is used as a basic implementation of an OLAP cube. If your fact table contains a 1 to many relationship to each of your dimensions in your data warehouse schema then it is appropriate to use a star schema. Although if your fact table has a many to many relationship with its dimensions (i.e. many rows in your fact equal many rows in your dimension) then you must resolve this using a snow flake schema where the bridge table contains a unique key to each row in the fact table.

An example of a 1 to many relationship (star schema) is a fact table which contains sales data, and a dimension table which contains a list of stores. 1 store can have many sales but each sale only comes from 1 store. i.e. 1 row in the dimension table can equal many rows in the fact table.

To modify the above example to make it a snow flake schema would be as follows:

a store can have many sales but each sale can come from many stores. This would be a many to many relationship and you would need a bridge table to implement this functional requirement.

Tuesday 28 July 2015

XML indentation in Unix

I have an XML file with no proper indentation.It has to be changed as XML tags indented.

Input:My input file looks like 

<a><b>c</b></a>
Output:
$ xmllint --format <myfilename>
<a>
  <b>c</b>
</a>

Sunday 26 July 2015

Generate the sequence numbers without using CREATE SEQUENCE

SELECT LEVEL n
FROM DUAL
CONNECT BY LEVEL <= 5;

Generate as many number of rows of the number in the table

CREATE TABLE RN(NUM NUMBER);

INSERT INTO RN VALUES(5);

SELECT NUM FROM RN CONNECT BY ROWNUM<=NUM;


Multi Column Sub query scenario

Display the details of hero who has acted in more than 2 movies in  each year.


HERO_ID =1 has more than 2 movies only in 2001.
HERO_ID=2 has more than 2 movies in every year.

SELECT HERO_ID FROM 
(
SELECT HERO_ID,RELEASE_YEAR FROM MOVIES GROUP BY HERO_ID,RELEASE_YEAR HAVING COUNT(*)>2
)
GROUP BY HERO_ID

HAVING COUNT(DISTINCT RELEASE_YEAR)>1

Friday 17 July 2015

Check permissions in Unix while executing a script


$ cat check-permissions.sh
#!/bin/bash
file=$1
# Handle non-absolute paths
if ! [[ "$file" == /* ]] ; then
    path=.
fi
dirname "$file" | tr '/' $'\n' | while read part ; do
    path="$path/$part"
    # Check for execute permissions
    if ! [[ -x "$path" ]] ; then
        echo "'$path' is blocking access."
    fi
done
if ! [[ -r "$file" ]] ; then
    echo "'$file' is not readable."
fi
$ ./check-permissions.sh /long/path/to/file.txt

Thursday 16 July 2015

Atomicity: Adhoc Query

I have a source as table loading the target.Suppose there are duplicate records in the middle of the record flow,what will be the target load resulted in?

CREATE TABLE INS(ID INTEGER);

CREATE TABLE INS_T(ID INTEGER PRIMARY KEY);

INSERT INTO INS VALUES(1);
INSERT INTO INS VALUES(2);
INSERT INTO INS VALUES(3);
INSERT INTO INS VALUES(4);
INSERT INTO INS VALUES(5);
INSERT INTO INS VALUES(6);
INSERT INTO INS VALUES(7);
INSERT INTO INS VALUES(8);


DECLARE
INS VARCHAR2(50);
BEGIN
INS:='SELECT ID FROM INS';
DBMS_OUTPUT.PUT_LINE('STARTED');
EXECUTE IMMEDIATE('INSERT INTO INS_T '||INS);
COMMIT;
DBMS_OUTPUT.PUT_LINE('ENDED');
EXCEPTION
WHEN OTHERS THEN
DBMS_OUTPUT.PUT_LINE('ABORTED');
END;

The above program in turn returns the message as ABORTED due to the exception raised by unique violation.

Since the control of the program goes from EXECUTE IMMEDIATE statement to the exception section, the COMMIT statement is unaffected.Hence no records inserted into the target table.

SELECT * FROM INS_T;

0 rows selected.

WITH clause and ROWNUM

SELECT SAL
FROM
(SELECT DISTINCT SAL FROM EMP ORDER BY SAL DESC)
WHERE ROWNUM<=3

(or)

WITH SORT_SAL AS
(SELECT DISTINCT SAL FROM EMP ORDER BY SAL DESC)
SELECT SAL FROM SORT_SAL WHERE ROWNUM<=3


Analytical Functions:FIRST and LAST

The FIRST and LAST functions can be used to return the first or last value from an ordered sequence. Say we want to display the salary of each employee, along with the lowest and highest within their department we may use something like.

SELECT
EMPNO,
DEPTNO,
SAL
       MIN(sal) KEEP (DENSE_RANK FIRST ORDER BY sal) OVER (PARTITION BY deptno) SAL_LOW
       MAX(sal) KEEP (DENSE_RANK LAST ORDER BY sal) OVER (PARTITION BY deptno) SAL_HIGH
FROM   emp
ORDER BY deptno, sal;


How to extract DATE from TIMESTAMP


DROP TABLE SYST;
CREATE TABLE SYST(LOAD_TS TIMESTAMP(6));
INSERT INTO SYST VALUES(CURRENT_TIMESTAMP(6));
INSERT INTO SYST VALUES(CURRENT_TIMESTAMP(6)+INTERVAL'1'DAY);
INSERT INTO SYST VALUES(CURRENT_TIMESTAMP(6)+INTERVAL'2'DAY);

SELECT * FROM SYST;


SELECT TRUNC(LOAD_TS) FROM SYST;


Tuesday 14 July 2015

ODS vs EDW

An ODS is a database that is subject-oriented, integrated, volatile and current. While EDW is a database that is subject-oriented, integrated, non-volatile (read-only) and time-variant (historical).

An ODS is designed to provide a source for reporting against current transactions from the OLTP application, and can also serve as the data source from the OLTP to the EDW. Providing reporting against the ODS reduces the performance impact against the OLTP application. As there may be a delay in moving the transactional data from the application to the EDW (unless near real time updates are in place), so the ODS serves the need for supplying immediate reporting on current activity.


Saturday 11 July 2015

Dimensional Modelers Do Not Focus on Logical vs. Physical

ER Modeling

The traditional distinction between logical and physical model is useful in ER modeling, but not in dimensional modeling. In the world of ER modeling, a logical model captures data requirements without assuming particular data storage technologies. It captures business entities and their attributes and relationships.

The logical model is the basis for a physical model, with reflects the requirements of relational storage in tables and columns. For example, many-to-many relationships are resolved, data may be restructured for performance reasons, etc.

Dimensional Models: Three Levels of Detail

Instead of having multiple kinds of model, a dimensional model is best understood at three levels of increasing detail.  Like zooming in on a Google map, each reveals additional information about the model. Each level of detail has different uses for different audiences.
  1. Business Requirements
    Requirements are grouped by subject area, correspond to business process, state measurement requirements in terms of facts and dimensions, and cross reference common dimensions.

    These business requirements clearly convey scope in business terms.  They link directly to the next level of detail in the model, which exposes the concept of table.
  2. High Level Design
    This level of the model defines the same requirements in terms of fact tables and dimension tables, natural keys an surrogate keys, and exposes major attributes of significance.

    At this level of detail, we do not record every column of every table, or even assign data types.  But we do draw table diagrams, and rigorously define several important design elements such as grain, additivity, and slow change requirements.

    This level is useful for design reviews, educating users and developers, and describing project activities.
  3. Detailed Design
    At the lowest level of detail, we expose every column of every table, define data types, provide definitions and sample data, map everything back to source data, and document transformation rules.

    This level of detail is useful for database administrators and ETL architects. It also contains metadata that will be useful for BI developers and end-users.

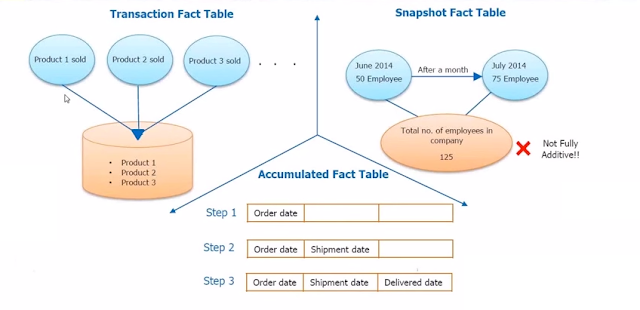
Accumulated Fact table


Snapshot Fact Table


Transaction Fact Table


Transaction Fact table can be fully additive


Fact Table Types


Type of Facts


Multiple Fact Tables

After learning the basics of dimensional modeling, the first real world challenge we face is understanding when and how to design multiple fact tables.  Until we learn to think in dimensional terms, the choice can be difficult.

You probably need different fact tables if:
  1. You have measurements with different periodicity
  2. You have measurements with different levels of detail
The first guideline suggests that if facts do not describe the same event, they probably belong in different fact tables. For example, orders and shipments do not always happen at the same time.  Order dollars and shipment dollars belong in separate fact tables.

The second guideline pertains to facts that do describe the same events.  Information about an order and information about an order line are ostensibly available at the same time, but they have different levels of detail. If there are facts at both of these levels, there will need to be multiple fact tables.


Wednesday 8 July 2015

JOIN or EXISTS

Both serves entirely different purposes.
You JOIN two tables to access related records. If you don't need to access the data in the related records then you have no need to join them.
EXISTS can be used to determine if a token exists in a given set of data but won't allow you to access the related records.
Suppose we have Institution and Results table,
With our two tables Institutions and Results if we want a list of institutions that have results, JOIN will be most efficient:
If you have an institution_id and just want to know if it has results, using EXISTS might be faster.

Sorted Input : Aggregator

Aggregator transformations often slow performance because they must group data before processing it. Aggregator transformations need additional memory to hold intermediate group results.

Using Sorted Input
To increase session performance, sort data for the Aggregator transformation. Use the Sorted Input option to sort data.

The Sorted Input option decreases the use of aggregate caches. When you use the Sorted Input option, the Integration Service assumes all data is sorted by group. As the Integration Service reads rows for a group, it performs aggregate calculations. When necessary, it stores group information in memory.

The Sorted Input option reduces the amount of data cached during the session and improves performance. Use this option with the Source Qualifier Number of Sorted Ports option or a Sorter transformation to pass sorted data to the Aggregator transformation.

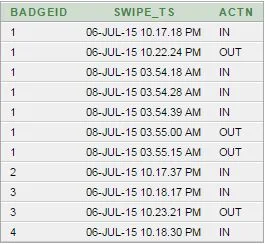
Swipe Details-Complex scenario

I have a table where Swipe IN ans Swipe OUT details are recorded.Suppose,If I need to find
How many employees are inside/outside the campus at any given point of time in a given day?

Assumption:There can be consecutive IN or OUT

SELECT * FROM SWIPE;


08-JUL-15 04.40.38 AM -----Point of time


SELECT ACTN,COUNT(*) FROM SWIPE
WHERE(BADGEID,SWIPE_TS)
IN
(
SELECT BADGEID,MAX(SWIPE_TS)
FROM SWIPE
WHERE SWIPE_TS<='08-JUL-15 04.40.38 AM'
GROUP BY BADGEID
)
GROUP BY ACTN


Swipe Details-Medium Scenario

I have a table where Swipe IN ans Swipe OUT details are recorded.Suppose,If I need to find
How many employees are inside/outside the campus?

Assumption:There can be consecutive IN or OUT.

SELECT * FROM SWIPE;


Outside Campus:
SELECT * FROM SWIPE
WHERE(BADGEID,SWIPE_TS)
IN
(
SELECT BADGEID,MAX(SWIPE_TS)
FROM SWIPE
GROUP BY BADGEID
)

AND ACTN='OUT'


Inside Campus:
SELECT * FROM SWIPE
WHERE(BADGEID,SWIPE_TS)
IN
(
SELECT BADGEID,MAX(SWIPE_TS)
FROM SWIPE
GROUP BY BADGEID
)

AND ACTN='IN'


Tuesday 7 July 2015

Managers who does not hire any employee for more than 2 months

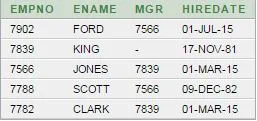
I have an employee table.I need to find the details of the manager who does not hire any employee for more than two months.


Input:


Output:

SELECT * FROM EMP_HIRE O
WHERE EMPNO IN
(
SELECT MGR FROM EMP_HIRE WHERE MGR=O.EMPNO AND  MONTHS_BETWEEN(SYSDATE,HIREDATE)>2
)


CONVERSION and DATE FUNCTIONS


Swipe Details-Simple Scenario

I have a table where Swipe IN ans Swipe OUT details are recorded.Suppose,If I need to find
How many employees are inside/outside the campus?

Assumption:For every IN,there is an OUT strictly.


CREATE TABLE SWIPE
(
BADGEID INTEGER,
SWIPE_TS TIMESTAMP(0),
ACTN VARCHAR2(3)
);

INSERT INTO SWIPE VALUES(1,CURRENT_TIMESTAMP(0)- INTERVAL '5' MINUTE,'IN');
INSERT INTO SWIPE VALUES(1,CURRENT_TIMESTAMP(0),'OUT');
INSERT INTO SWIPE VALUES(2,CURRENT_TIMESTAMP(0)- INTERVAL '5' MINUTE,'IN');
INSERT INTO SWIPE VALUES(3,CURRENT_TIMESTAMP(0)- INTERVAL '5' MINUTE,'IN');
INSERT INTO SWIPE VALUES(3,CURRENT_TIMESTAMP(0),'OUT');
INSERT INTO SWIPE VALUES(4,CURRENT_TIMESTAMP(0)- INTERVAL '5' MINUTE,'IN');

SELECT * FROM SWIPE;


Approach 1:

Inside Campus:


SELECT BADGEID
FROM SWIPE
GROUP BY BADGEID
HAVING MOD(COUNT(*),2)=1


Outside Campus:


SELECT BADGEID
FROM SWIPE
GROUP BY BADGEID
HAVING MOD(COUNT(*),2)=0