A highly motivated and ambitious individual able to give timely and accurate advice, guidance, support and training to team members and individuals. Having the ability to work with the minimum of supervision whilst leading a team. Having a proven ability to lead by example, consistently hit targets, improves best practices and organizes time efficiently.
Showing posts with label Data Modeling. Show all posts
Showing posts with label Data Modeling. Show all posts
Saturday, 5 September 2015
Normalization vs Denormalization
Normalization:
PROS:
- When writes are more than reads
- Vertically divided among columns i.e. split-ted into multiple tables.
- Updates and Inserts will be effective since no duplicates.
- Less use of heavy DISTINCT or GROUP BY queries since no duplicates.
CONS:
- JOINS due to multiple tables.
- Index strategies are not effective due to joins.
De-Normalization:
PROS:
- When reads are more than writes.
- SELECTS are very fast since we avoid JOINS and effective because of index strategies works very well with selective columns.
CONS:
- Updates and INSERTS becomes costly.
In real time , you should be good enough to choose the most read or most write tables to apply this concepts.
Thursday, 27 August 2015
Wednesday, 29 July 2015
Difference between Conceptual, Logical and Physical Data Models.
The three level of data modeling:-
Conceptual data model
A conceptual data model identifies the highest-level relationships between the different entities. Features of conceptual data model include:
· Includes the important entities and the relationships among them.
· No attribute is specified.
· No primary key is specified.
Logical data model
A logical data model describes the data in as much detail as possible, without regard to how they will be physical implemented in the database. Features of a logical data model include:
· Includes all entities and relationships among them.
· All attributes for each entity are specified.
· The primary key for each entity is specified.
· Foreign keys (keys identifying the relationship between different entities) are specified.
· Normalization occurs at this level.
The steps for designing the logical data model are as follows:
1. Specify primary keys for all entities.
2. Find the relationships between different entities.
3. Find all attributes for each entity.
4. Resolve many-to-many relationships.
5. Normalization.
Physical data model
Physical data model represents how the model will be built in the database. A physical database model shows all table structures, including column name, column data type, column constraints, primary key, foreign key, and relationships between tables. Features of a physical data model include:
- Specification all tables and columns.
- Foreign keys are used to identify relationships between tables.
- Denormalization may occur based on user requirements.
- Physical considerations may cause the physical data model to be quite different from the logical data model.
- Physical data model will be different for different RDBMS. For example, data type for a column may be different between Oracle, DB2 etc.
The steps for physical data model design are as follows:
- Convert entities into tables.
- Convert relationships into foreign keys.
- Convert attributes into columns.
- Modify the physical data model based on physical constraints / requirements.
Here we compare these three types of data models. The table below compares the different features:
Feature
|
Conceptual
|
Logical
|
Physical
|
Entity Names
|
✓
|
✓
| |
Entity Relationships
|
✓
|
✓
| |
Attributes
|
✓
| ||
Primary Keys
|
✓
|
✓
| |
Foreign Keys
|
✓
|
✓
| |
Table Names
|
✓
| ||
Column Names
|
✓
| ||
Column Data Types
|
✓
|
We can see that the complexity increases from conceptual to logical to physical. This is why we always first start with the conceptual data model (so we understand at high level what are the different entities in our data and how they relate to one another), then move on to the logical data model (so we understand the details of our data without worrying about how they will actually implemented), and finally the physical data model (so we know exactly how to implement our data model in the database of choice). In a data warehousing project, sometimes the conceptual data model and the logical data model are considered as a single deliverable.
Snowflake Schema: "Need of the Hour"
In snowflake schema, you further normalize the dimensions. Ex: a typical Date Dim in a star schema can further be normalized by storing Quarter Dim, Year dim in separate dimensions.
Snowflake schema is generally used if:
1) You have a requirement where you don't need to frequently query a certain set of dimension data but still need it for information purposes. By storing this data in a separate dimension, you are reducing redundancy in main dimensions.
2) You have a reporting or cube architecture that needs hierarchies or slicing feature.
3) You have fact tables that have different level of granularity. Ex: You have sales fact table where you are tracking sales at product level. Then you also have budget fact table where you are tracking budgeting by product category.
It is, however, not recommended because it increases the joins and complexity of your query and hence slows down the performance.
PS: Bridge tables are not snowflake but bridge tables. The purpose of bridge tables are to resolve m:m relationship. A snowflake dimension would have further (or leaf level) information of the parent dimension stored for usability and storage.
When does it make sense to use a Snowflake Schema vs. Star Schema in database design?
A star schema is used as a basic implementation of an OLAP cube. If your fact table contains a 1 to many relationship to each of your dimensions in your data warehouse schema then it is appropriate to use a star schema. Although if your fact table has a many to many relationship with its dimensions (i.e. many rows in your fact equal many rows in your dimension) then you must resolve this using a snow flake schema where the bridge table contains a unique key to each row in the fact table.
An example of a 1 to many relationship (star schema) is a fact table which contains sales data, and a dimension table which contains a list of stores. 1 store can have many sales but each sale only comes from 1 store. i.e. 1 row in the dimension table can equal many rows in the fact table.
To modify the above example to make it a snow flake schema would be as follows:
a store can have many sales but each sale can come from many stores. This would be a many to many relationship and you would need a bridge table to implement this functional requirement.
Sunday, 5 July 2015
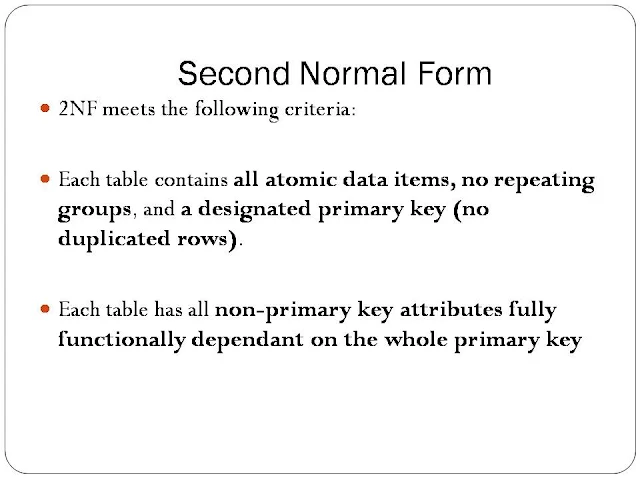
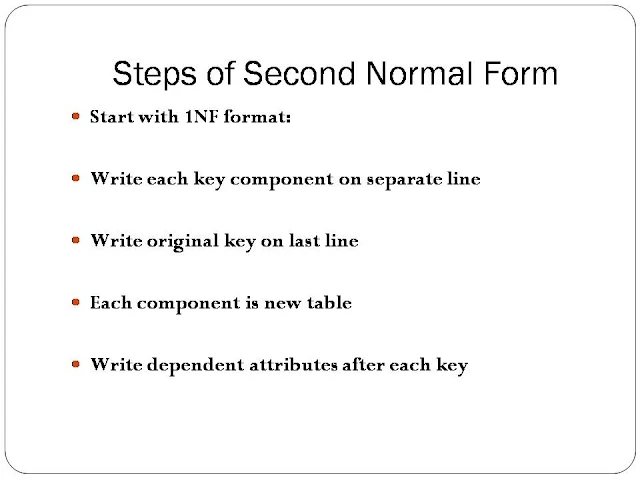
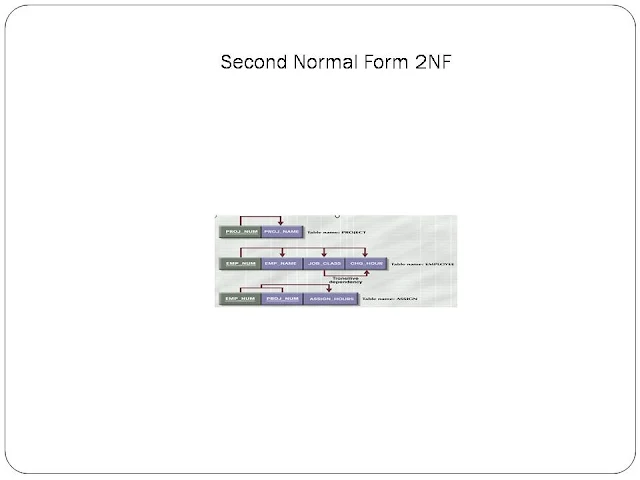
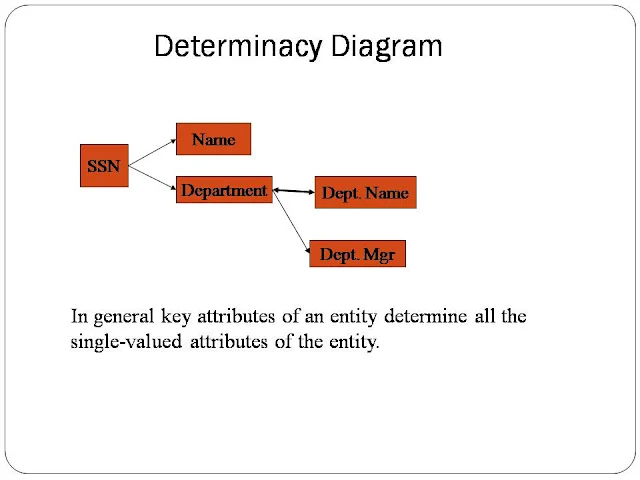
Normalization
•Normalization
is the process of discarding repeating groups, minimizing redundancy,
eliminating composite keys for partial dependency and separating non-key attributes.
•In
simple terms : "Each attribute (column) must be a fact about the key,
the whole key, and nothing but the key." Said another way, each table should describe only one
type of entity (information).
Identifying and Non Identifying relationships
Relationships between two entities may be classified as being either "identifying" or "non-identifying". Identifying relationships exist when the primary key of the parent entity is included in the primary key of the child entity. On the other hand, a non-identifying relationship exists when the primary key of the parent entity is included in the child entity but not as part of the child entity's primary key. In addition, non-identifying relationships may be further classified as being either "mandatory" or "non-mandatory". A mandatory non-identifying relationship exists when the value in the child table cannot be null. On the other hand, a non-mandatory non-identifying relationship exists when the value in the child table can be null.
Here's a simple example of an identifying relationship:
Parent
------
ID (PK)
Name
Child
-----
ID (PK)
ParentID (PK, FK to Parent.ID) -- notice PK
Name
Here's a corresponding non-identifying relationship:
Parent
------
ID (PK)
Name
Child
-----
ID (PK)
ParentID (FK to Parent.ID) -- notice no PK
Name
Here's a simple example of an identifying relationship:
Parent
------
ID (PK)
Name
Child
-----
ID (PK)
ParentID (PK, FK to Parent.ID) -- notice PK
Name
Here's a corresponding non-identifying relationship:
Parent
------
ID (PK)
Name
Child
-----
ID (PK)
ParentID (FK to Parent.ID) -- notice no PK
Name
Friday, 3 July 2015
Conceptual Data Modeling
- Done in Initial phase of planning in constructing a top-down approach.
- Get the business requirements from various sources like business docs,Functional teams,Business analysts,SME's and report users.
- It's a high level graphical represntation of a business of the organization.
- Starts with main subject area and identify the relationship with the other subject areas as well.
- Define entities in a subject area and their relationships,which is represented by cardinality(1:1,1:M,M:N)
- It is sent to functional team for review.
Eg: Bank has different subject areas like Savings,Credit cards,Investment,Retirement Plan Service.
Subscribe to:
Comments (Atom)


