Showing posts with label DWH Concepts. Show all posts

Thursday, 30 July 2015

Mixed Grain Fact Table

A mixed grain fact table is a fact table where we have measures with different grain. For example, one measure is weekly whereas the other measure is monthly. In this post I’d like to go through the advantages and disadvantages of that approach. The Kimball group clearly stated that measures in a fact table must have the same grain, see Kimball’s Toolkit book chapter 2.
As usual it is easier to explain “by example”:
It is a data mart. They have measures per week and per month, but they don’t have the measure on daily basis. Should we have 2 fact tables, one for weekly and one for monthly, like this: (1)
Or should we create a mixed grain fact table like this: (2)
In the above fact table, the black lines are weekly figures, whereas the red lines are monthly figures. They are both put in the same fact table, but on different measure columns. On the rows where the weekly measure exist, the monthly measure is zero. And vice versa. Therefore weekly and monthly total are correct:
select D.Week, sum(F.WeeklyMeasure) from FactMixedGrain F
join DimDate D on F.DimDate = D.DimDate group by D.Week
Result:
select D.Month, sum(F.MonthlyMeasure) from FactMixedGrain F
join DimDate D on F.DimDate = D.DimDate group by D.Month
Result:
Usually the main reason of doing option (2) is to have both the weekly and monthly measures in 1 fact table. This is done to save development effort, particularly ETL effort. It is easier to populate just 1 table than two tables.
That’s the advantage. Now the disadvantages. The issue with option (2) is that the grain of the fact table is mixed. There are 2 grains. In practice we have other dimension key columns in the fact table. And we also have other measure columns in the fact table. Some of these measures are weekly and some of them are monthly. Perhaps some of these measures are daily.
The issues with a fact table with a mixed grain like that are:
  1. When the reporting from the table, we are risking mixing measures with different grains in the same formula, resulting in meaningless result.
  2. The DateKey is used to indicate both the end of week and the end of month. This requires certain logic in the ETL, which prolong its development.
  3. In the fact table we have black and red lines, indicating weekly and monthly grain. Black for weekly and red for monthly. We may end up having yellow lines too, for daily. And blue lines too, for quarterly. Oh, and green lines too, for yearly. After that, it will be very confusing. When we query the fact table, we wouldn’t be able to tell which line is which.
  4. When we join this fact table with another fact table (drilling across), we are risking joining the wrong rows.
In option (2) above, the date dimension is used for 2 different grains in the fact table. Other examples like this are:
  1. Product dimension used at the product group level and at the product category level.
  2. Customer dimension used at the company level and at the group level.
When we have 2 or 3 dimensions, with each has dual grain like that, it becomes really confusing and risky.
In the above example, the same dimension key column has dual grain. In other cases, the mixed grain in the fact table is caused by different dimension key columns. One measure correspond to dim1, where as another measure correspond to dim2. Where measure1 has value, measure 2 is 0. And vice versa, like this:
And so it becomes really confusing. So I would recommend avoiding this design, mixing measures with different grains into the same fact table. Instead, it is better to put them into separate fact tables.

Wednesday, 29 July 2015

Snowflake Schema: "Need of the Hour"

In snowflake schema, you further normalize the dimensions. Ex: a typical Date Dim in a star schema can further be normalized by storing Quarter Dim, Year dim in separate dimensions. 

Snowflake schema is generally used if:

1) You have a requirement where you don't need to frequently query a certain set of dimension data but still need it for information purposes. By storing this data in a separate dimension,  you are reducing redundancy in main dimensions.

2) You have a reporting or cube architecture that needs hierarchies or slicing feature. 

3) You have fact tables that have different level of granularity. Ex: You have sales fact table where you are tracking sales at product level. Then you also have budget fact table where you are tracking budgeting by product category. 

It is, however, not recommended because it increases the joins and complexity of your query and hence slows down the performance.

PS: Bridge tables are not snowflake but bridge tables. The purpose of bridge tables are to resolve m:m relationship. A snowflake dimension would have further (or leaf level) information of the parent dimension stored for usability and storage.

When does it make sense to use a Snowflake Schema vs. Star Schema in database design?

A star schema is used as a basic implementation of an OLAP cube. If your fact table contains a 1 to many relationship to each of your dimensions in your data warehouse schema then it is appropriate to use a star schema. Although if your fact table has a many to many relationship with its dimensions (i.e. many rows in your fact equal many rows in your dimension) then you must resolve this using a snow flake schema where the bridge table contains a unique key to each row in the fact table.

An example of a 1 to many relationship (star schema) is a fact table which contains sales data, and a dimension table which contains a list of stores. 1 store can have many sales but each sale only comes from 1 store. i.e. 1 row in the dimension table can equal many rows in the fact table.

To modify the above example to make it a snow flake schema would be as follows:

a store can have many sales but each sale can come from many stores. This would be a many to many relationship and you would need a bridge table to implement this functional requirement.

Tuesday, 14 July 2015

ODS vs EDW

An ODS is a database that is subject-oriented, integrated, volatile and current. While EDW is a database that is subject-oriented, integrated, non-volatile (read-only) and time-variant (historical).

An ODS is designed to provide a source for reporting against current transactions from the OLTP application, and can also serve as the data source from the OLTP to the EDW. Providing reporting against the ODS reduces the performance impact against the OLTP application. As there may be a delay in moving the transactional data from the application to the EDW (unless near real time updates are in place), so the ODS serves the need for supplying immediate reporting on current activity.


Saturday, 11 July 2015

Dimensional Modelers Do Not Focus on Logical vs. Physical

ER Modeling

The traditional distinction between logical and physical model is useful in ER modeling, but not in dimensional modeling. In the world of ER modeling, a logical model captures data requirements without assuming particular data storage technologies. It captures business entities and their attributes and relationships.

The logical model is the basis for a physical model, with reflects the requirements of relational storage in tables and columns. For example, many-to-many relationships are resolved, data may be restructured for performance reasons, etc.

Dimensional Models: Three Levels of Detail

Instead of having multiple kinds of model, a dimensional model is best understood at three levels of increasing detail.  Like zooming in on a Google map, each reveals additional information about the model. Each level of detail has different uses for different audiences.
  1. Business Requirements
    Requirements are grouped by subject area, correspond to business process, state measurement requirements in terms of facts and dimensions, and cross reference common dimensions.

    These business requirements clearly convey scope in business terms.  They link directly to the next level of detail in the model, which exposes the concept of table.
  2. High Level Design
    This level of the model defines the same requirements in terms of fact tables and dimension tables, natural keys an surrogate keys, and exposes major attributes of significance.

    At this level of detail, we do not record every column of every table, or even assign data types.  But we do draw table diagrams, and rigorously define several important design elements such as grain, additivity, and slow change requirements.

    This level is useful for design reviews, educating users and developers, and describing project activities.
  3. Detailed Design
    At the lowest level of detail, we expose every column of every table, define data types, provide definitions and sample data, map everything back to source data, and document transformation rules.

    This level of detail is useful for database administrators and ETL architects. It also contains metadata that will be useful for BI developers and end-users.

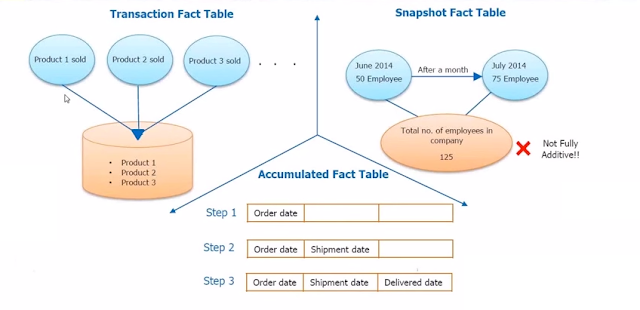
Accumulated Fact table


Snapshot Fact Table


Transaction Fact Table


Transaction Fact table can be fully additive


Fact Table Types


Type of Facts


Multiple Fact Tables

After learning the basics of dimensional modeling, the first real world challenge we face is understanding when and how to design multiple fact tables.  Until we learn to think in dimensional terms, the choice can be difficult.

You probably need different fact tables if:
  1. You have measurements with different periodicity
  2. You have measurements with different levels of detail
The first guideline suggests that if facts do not describe the same event, they probably belong in different fact tables. For example, orders and shipments do not always happen at the same time.  Order dollars and shipment dollars belong in separate fact tables.
The second guideline pertains to facts that do describe the same events.  Information about an order and information about an order line are ostensibly available at the same time, but they have different levels of detail. If there are facts at both of these levels, there will need to be multiple fact tables.


Wednesday, 1 July 2015

DATA , INFORMATION and KNOWLEDGE

You run a local departmental store and you log all the details of your customers in the store database. You know the names of your customers and what items they buy each day.
For example, Alex, Jessica and Paul visit your store every Sunday and buys candle. You store this information in your store database. This is data. Any time you want to know who are the visitors that buy candle, you can query your database and get the answer. This is information. You want to know how many candles are sold on each day of week from your store, you can again query your database and you’d get the answer – that’s also information.
But suppose there are 1000 other customers who also buy candle from you on every Sunday (mostly – with some percentage of variations) and all of them are Christian by religion. So, you can conclude that Alex, Jessica and Paul must be also Christian.
Now the religion of Alex, Jessica and Paul were not given to you as data. This could not be retrieved from the database as information. But you learnt this piece of information indirectly. This is the ”knowledge” that you discovered. And this discovery was done through a process called “Data Mining”.
Now there are chances that you are wrong about Alex, Jessica and Paul. But there are fare amount of chances that you are actually right. That is why it is very important to “evaluate” the result of KDD process.
I gave you this example because I wanted to make a clear distinction between knowledge and information in the context of data mining. This is important to understand our first question – why retrieving information from deep down of your database is not same as data mining. No matter how complex the information retrieval process is, no matter how deep the information is located at, it’s still not data mining.
As long as you are not dealing with predictive analysis or not discovering “new” pattern from the existing data – you are not doing data mining.

Thursday, 18 June 2015

factless fact table


A fact table with  statistical information but without measures

It can view the number of occurring events 

Example : 
- A number of accidents occurred in a month.

ETL Architect Sample Questions


Depending on who's doing the interview and how serious they are:

-Describe advantages of the CIF architecture versus the bus architecture with conformed dimensions. Which would fit best in our environment given [some parameters they give you] and why
-Describe snowflaking
-Describe factless fact tables.
-Draw a star schema of our business
-Describe common optimization techniques applied at the data model level
-How do you handle data rejects in a warehouse architecture?
-Describe common techniques for loading from the staging area to the warehouse when you only have a small window.
-How do you load type 1 dimensions
-How do you load type 2 dimensions, and how would you load it given our [insert business particularity]
-How would you model unbalanced hierarchies
-How would you model cyclic relations
-What major elements would you include in an audit model?
-How would you implement traceability?

Sunday, 14 June 2015

What is Degenerate Dimension ?

A Degenerate dimension is a Dimension which has only a single attribute. This dimension is typically represented as a single field in a fact table.The data items that are not facts and data items that do not fit into the existing dimensions are termed as Degenerate Dimensions. Degenerate Dimensions are used when fact tables represent transaction data.They can be used as primary key for the fact table but they cannot act as foreign keys. 

Saturday, 16 May 2015

Separating the warehouse tables from the Relational database

Having them in different schema clearly identifies their purpose.

In most cases separating the warehouse tables from the relational database is considered a best practice. Some of the reasons for doing this are:


Conceptual separation.  In short relational databases and data warehouses are different types of SQL server databases and should be treated that way.


Security Separation:  While implementing security is possible at a schema level, it is much easier to set up security at the database level.

Backups:  This might be the biggest reason for wanting to separate the data warehouse from another database.  Typically a data warehouse is backed up using a Simple Recovery Model where the transaction logs are not backed up. This is done because data warehouses are very large, but aren’t written to very often.  A relational database is typically backed up using the Full Recovery Model, where the transaction logs are maintained and backed up regularly. The database can be recreated using the last back up and the transaction logs.


Friday, 5 September 2014

Factless Fact table


When a fact table does not contain any facts, it is called a factless fact table.
 There are two types of factless fact tables: those that describe events, and those that describe conditions. Both may play important roles in your dimensional models. 

Factless fact table for event or activity

When designing dimensional model, you often find that you want to track events or activities that occurs in your business process but you can’t find measures to track.  In these situations, you can create a transaction-grained fact table that has no facts to describe that events or activities. Even though there are no facts storing in the fact table, the event can be counted to produce very meaningful process measurements.

Factless fact table for event or activity example

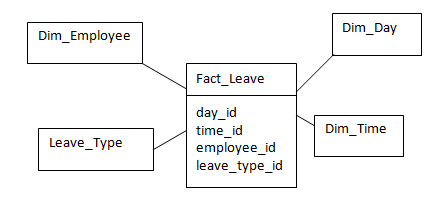
For example, you may want to track employee leaves. How often and why your employee leaves are very important for you to plan your daily activities and resources.
At the center of diagram below is the FACT_LEAVE table that has no facts at all. However theFACT_LEAVE table is used to measure employee leave event when it occurs.
Factless Fact Table - Example 1Query to retrieve the leave details of an employee: 
SELECT ENAME,COUNT(LEAVE_ID)
FROM FACT_LEAVE JOIN DIM_EMPLOYEE
ON FACT_LEAVE.EMPNO=DIM_EMPLOYEE.EMPNO
GROUP BY ENAME;

Factless fact table for condition, eligibility or coverage

Factless fact table can be also used in these situations:
  • Tracking salesperson assigned to each prospect or customer
  • Logging the eligibility of employees for a compensation program
  • Capturing the promotion campaigns that are active at specific times such as holidays.
Those examples above describe conditions, eligibility or coverage. The factless fact table can be used to model conditions, eligibility or coverage.  Typically information is captured by this star will not be studied alone but used with other business processes to produce meaningful information.
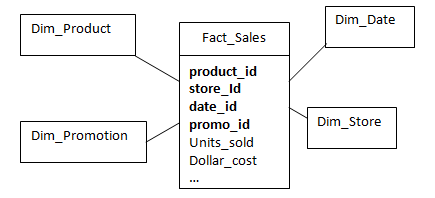
Let’s take a look at the sale star below. By looking only at the star, we don’t know what product has promotion that did not sell.
Sales Star Schema
Sales Star Schema
In order to track this kind of information, we can create a star that has factless fact table which is known as coverage table (according to Kimball).
Factless Fact Table -  Example 2
Factless Fact Table – Example 2
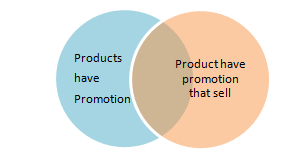
In order to answer the question: what product that has promotion did not sell, we need to do as follows:
  • Look at the second star to find out products that have promotions.
  • Look at the first star to find out products that have promotion that sell.
  • The difference between is the list of products that have promotion but did not sell.
Factless fact table Example 2
Factless fact table is crucial in many complex business processes. By applying concepts and techniques about factless fact table in this tutorial, you can design a dimensional model that has no clear facts to produce more meaningful information for your business processes.
Courtesy:zentut

Wednesday, 27 August 2014

Normalized Vs Dimensional Approach in DWH

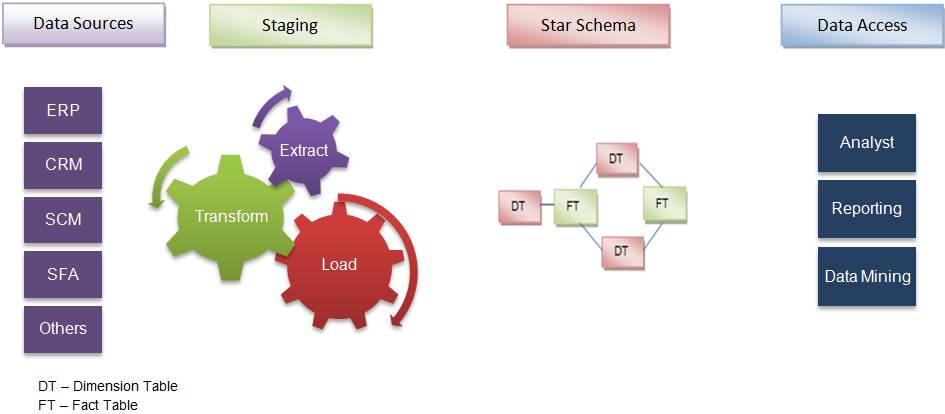
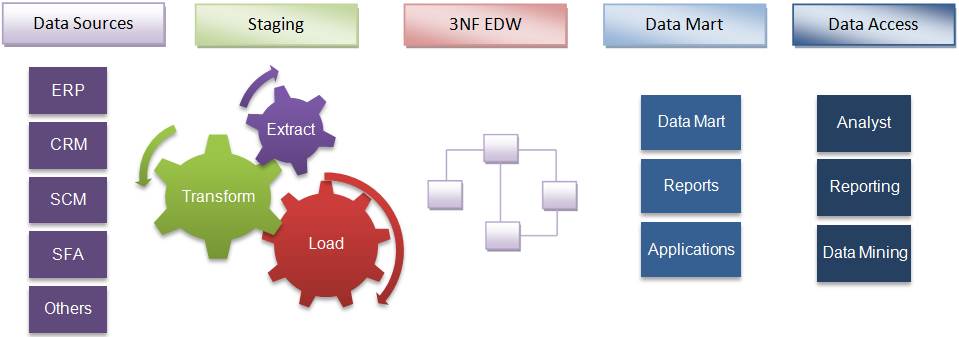
The dimensional approach, made popular by in Ralph Kimball (website), states that the data warehouse should be modeled using a Dimensional Model (star schema or snowflake).  The normalized approach, also called the 3NF model, made popular by Bill Inmon (website), states that the data warehouse should be modeled using an E-R model/normalized model.

In a dimensional approach, data is partitioned into either “facts”, which are generally numeric transaction data, or “dimensions“, which are the reference information that gives context to the facts.  A key advantage of a dimensional approach is that the data warehouse is easier for the user to understand and to use.  Also, the retrieval of data from the data warehouse tends to operate very quickly.  The main disadvantage of the dimensional approach is that In order to maintain the integrity of facts and dimensions, loading the data warehouse with data from different operational systems is complicated.  Plus, if you are used to working with a normalized approach, it can take a while to fully understand the dimensional approach and to become efficient in building one.

In the normalized approach, the data in the data warehouse are stored following database normalization rules.  Tables are grouped together by subject areas that reflect general data categories (e.g., data on customers, products, finance, etc.).  The normalized structure divides data into entities, which creates several tables in a relational database.  When applied in large enterprises the result is dozens of tables that are linked together by a web of joins.  Furthermore, each of the created entities is converted into separate physical tables when the database is implemented.  The main advantage of this approach is that it is straightforward to add information into the database.  A disadvantage of this approach is that, because of the number of tables involved, it can be difficult for users both to join data from different sources into meaningful information and then access the information without a precise understanding of the sources of data and of the data structure of the data warehouse.

Top-Down vs Bottom-Up Approach

Inmon’s top-down approach


Inmon defines data warehouse as a centralized repository for the entire enterprise. Data warehouse stores the ‘atomic’ data at the lowest level of detail. Dimensional data marts are created only after the complete data warehouse has been created. Thus, data warehouse is at the center of the Corporate Information Factory (CIF), which provides a logical framework for delivering business intelligence.
Inmon defines the data warehouse in the following terms:
  1. Subject-oriented: The data in the data warehouse is organized so that all the data elements relating to the same real-world event or object are linked together
  2. Time-variant: The changes to the data in the database are tracked and recorded so that reports can be produced showing changes over time
  3. Non-volatile: Data in the data warehouse is never over-written or deleted -- once committed, the data is static, read-only, and retained for future reporting
  4. Integrated: The database contains data from most or all of an organization's operational applications, and that this data is made consistent

Kimball’s bottom-up approach


Keeping in mind the most important business aspects or departments, data marts are created first. These provide a thin view into the organizational data, and as and when required these can be combined into a larger data warehouse. Kimball defines data warehouse as “A copy of transaction data specifically structured for query and analysis”.
Kimball’s data warehousing architecture is also known as Data Warehouse Bus (BUS). Dimensional modeling focuses on ease of end user accessibility and provides a high level of performance to the data warehouse.

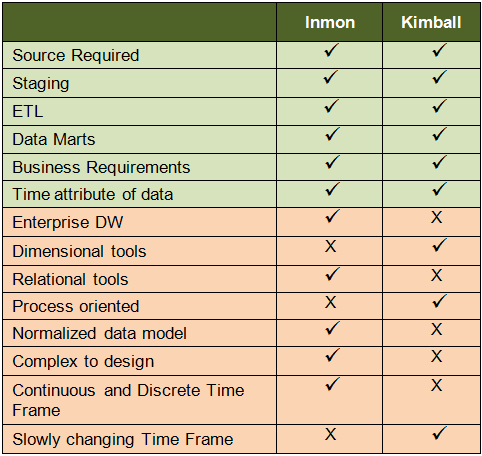
Inmon vs. Kimball: Similar or different?


"You can catch all the minnows in the ocean and stack them together and they still do not make a whale." ~Inmon
“The data warehouse is nothing more than the union of all the data marts" ~Kimball


Pros and cons of both the approaches


Courtesy:Sansu George is a business analyst at ABIBA Systems
http://searchbusinessintelligence.techtarget.in/tip/Inmon-vs-Kimball-Which-approach-is-suitable-for-your-data-warehouse

Difference Between an ODS and a Datawarehouse

Answer1:
An ODS is a database that is subject-oriented, integrated, volatile and current. It is usually used by business managers, analysts or customer service representatives to monitor, manage and improve daily business processes and customer service. An ODS is often loaded daily or multiple times a day with data that represents the current state of operational systems. 

An EDW is a database that is subject-oriented, integrated, non-volatile (read-only) and time-variant (historical). It is usually used by financial analysts for historical trend analysis reporting, data mining and other activities that need historical data. An EDW keeps growing as you add more historical snapshots, either daily, weekly or monthly. Because an EDW has historical data (and the ODS usually does not), some companies use the EDW as a hub for loading their data marts.


Answer2:
To a business user/information consumer, an ODS is best described as a means of moving  the reporting function from the transactional systems so that users can report on current activity without impacting the performance of the transactional system. That is why the concept of an ODS was created. It is not a duplicate/copy of the OLTP system, but is designed to readily load transactions (DB logs) as well as facilitate creation of reports. The ODS may carry (store) data a little longer than the OLTP system, but generally it is defined as current/short term data. An ODS is normally tied to one OLTP system, so in a larger organization you may see multiple ODS instances.

ODS system generally works as a complementary system to EDW to achieve near real time analysis of important business facts. e.g. by end of every six hours, for a online marketing portal, it might be important to calculate total sales $ irrespective to whatever views (geography, marketing channels etc) sales has been done.

The DW on the other hand is the longer term repository of transactional data, and is designed around subject areas, rather than transactional applications. It normally has multiple systems sending data to it, and some of those systems can be ODS. It is designed to store data at the lowest level of detail (atomic) available from the data sources. The DW (or EDW) is the principle resource for providing normalized data to the business intelligence (BI) layer, either indirectly through a data mart/application or (infrequently) through direct query. Whether the DW design is 3NF or dimensional (federated data marts) probably wouldn't be of much concern to the end user. They just want a conformed, confident source of information without having to go to multiple sources to get it.